Saturday 21 April 2012
Week 14 : Presentation Day / Engineer's Day for UniKL BMI (S1/2012)
Week No : 14 Date : 24/4/2012
Title of Activity : Presentation Day / Engineer's Day for UniKL BMI (S1/2012)
Objective :
1) To present the project on the Engineer's Day.
2) To get the evaluation & marks about the project from the assessors.
Content / Procedure :
1) The details about the Engineer's Day for UniKL BMi session S1/2012 :
Day : Tuesday
Date : 24th April 2012
Venue : Foyer TTL / Dewan Gemilang Hall
Time : 12.00 pm - 5.00 pm
2) Get the turn to be evaluated from the assessor according to the listed number in RPS.
Result and Analysis :
1) The event is conducted by the committees of FYP.
2) All the progress of event going well & smooth.
Conclusion :
1) The winner for the top 20th of project is announced on the end of event and the competition will be proceed on Thursday ( 26/4/2012 ).
2) Final progress is submitted the final report of project and finished up the progress of blog.
Thursday 19 April 2012
Week 13 : Complete poster & blog for FYP S1/2012
Week No : 13 Date : 19/4/2012
Title of Activity : Complete poster & blog for FYP S1/2012
Objective :
1) To design the poster of smart phototherapy.
2) To complete up the progress of blog for FYP session S1/2012
Content / Procedure :
1) Design the poster by using Microsoft Power Point.
2) The contains of poster including the brief of smart phototherapy ( abstract, methodology, results, analysis, conclusion , & etc ).
3) Complete up the blog progress ; which is starting from Week 1 until Week 14.
Result and Analysis :
1) The poster will be used during the presentation on the Engineering's Day that will be held on 24th April 2012.
2) It also used as the ' additional method ' to explain brief & details to the assessors besides using the power point slide and prototype about what's the smart phototherapy about.
Conclusion :
1) It will give the easiest way to tell the readers about the smart phototherapy.
2) To enhance a little bit of knowledge about relationship between combination of medical and electronic concepts.
PICTURE OF POSTER for SMART PHOTOTHERAPY

Saturday 7 April 2012
Week 11 : Result of the core temperature
Week No : 11 Date : 5/4/2012
Title of Activity : Result of the core temperature (38oC ).
Objective :
1) To figure out the suitable result for the end of actual core temperature.
2) To determine the design of temperature graph.
3) To complete up for the final progress of project.
Content / Procedure :
1) All the hardware & software parts are combine altogether.
2) The LM35 is used as heat sensor to detect the changing of temperature.
3) Testing part will be occurred by using 2 bulbs and 3 bulbs. The tables for both results will be constructed.
4) By setting up the ambient temperature (Ta) with starting of 26⁰C. Then, the setting point (S.P) button will be pushed to increase the temperature. Thus, the differences of emitting light happened on the bulbs.
5) Then, the results from the difference type of bulbs ( 2 bulbs / 3 bulbs ) will be graphed on the graph of temperature.
6) Analyse from the both results.
Result and Analysis :
1) Result & graph result of temperature in smart phototherapy by using 2 bulbs.

Figure 1 : Result & graph result of temperature in smart phototherapy by using 2 bulbs
- The ambient temperature (Ta) is set with (26⁰C). It took 7 seconds to increase to (27⁰C). From 0 second to 44seconds, the PWM circuit gives a 100% in performance of duty cycle.
- The set point of temperature (S.P) is (37⁰C).
- At (30⁰C), the PWM circuit stabilizes the heat produced by bulbs by changing the performance of duty cycle at 90% and 50%.
2) Result & graph result of temperature in smart phototherapy by using 3 bulbs.

Figure 2 : Result & graph result of temperature in smart phototherapy by using 3 bulbs
- The ambient temperature (Ta) during experimenting was (26⁰C). It took 8 seconds to increase to (27⁰C). From 0 second to 40seconds, the PWM circuit gives a 100% in performance of duty cycle.
- The set point of temperature (S.P) is (37⁰C).
- At (30⁰C), the PWM circuit stabilizes the heat produced by bulbs by changing the performance of duty cycle at 90% and 50%.
3) Results on the Pulse Width Modulation (PWM)

Figure 3 : Results on the Pulse Width Modulation (PWM)
- 100% performance of duty cycle : Refer to the Figure 3, at this stage,
the temperature increase until 30⁰C
which is 7⁰C before the set temperature in
40seconds.
- 90% performance of duty cycle : Refer to Figure 3, the temperature will increase until it reaches at the set point temperature, 37⁰C. This increment is happened in 112 seconds. At this stage, the PWM circuit will turn to 50% of duty cycle’s performance.
- 50% performance of duty cycle : At this stage, the PWM circuit controls the heat produce either in 50% or 0% (cut-off) to maintain the temperature at 38⁰C in the compartments.
Conclusion :
1) The LM35 is chose to be a heat sensor because of it generates a higher output voltage and proportional to the Celsius (oC) temperature.
2) Regarding on the graph in Figure 1, it shows that there is no overshoot temperature when using 2 bulbs.
3) Regarding on the graph in Figure 2 , it shows that there is an overshoot temperature when using 3 bulbs. The overshoot was in (2⁰C) over the set temperature. When the temperature was (2⁰C) more than set temperature, the PWM circuit will cut off and no heat was produced by bulb. The temperature decreased to set temperature.
4) The PWM method is used because of it is able to control the heat produced by the heat elements in percentage, 100%, 90% or 50%.
Title of Activity : Result of the core temperature (38oC ).
Objective :
1) To figure out the suitable result for the end of actual core temperature.
2) To determine the design of temperature graph.
3) To complete up for the final progress of project.
Content / Procedure :
1) All the hardware & software parts are combine altogether.
2) The LM35 is used as heat sensor to detect the changing of temperature.
3) Testing part will be occurred by using 2 bulbs and 3 bulbs. The tables for both results will be constructed.
4) By setting up the ambient temperature (Ta) with starting of 26⁰C. Then, the setting point (S.P) button will be pushed to increase the temperature. Thus, the differences of emitting light happened on the bulbs.
5) Then, the results from the difference type of bulbs ( 2 bulbs / 3 bulbs ) will be graphed on the graph of temperature.
6) Analyse from the both results.
Result and Analysis :
1) Result & graph result of temperature in smart phototherapy by using 2 bulbs.

- The ambient temperature (Ta) is set with (26⁰C). It took 7 seconds to increase to (27⁰C). From 0 second to 44seconds, the PWM circuit gives a 100% in performance of duty cycle.
- The set point of temperature (S.P) is (37⁰C).
- At (30⁰C), the PWM circuit stabilizes the heat produced by bulbs by changing the performance of duty cycle at 90% and 50%.
2) Result & graph result of temperature in smart phototherapy by using 3 bulbs.

Figure 2 : Result & graph result of temperature in smart phototherapy by using 3 bulbs
- The ambient temperature (Ta) during experimenting was (26⁰C). It took 8 seconds to increase to (27⁰C). From 0 second to 40seconds, the PWM circuit gives a 100% in performance of duty cycle.
- The set point of temperature (S.P) is (37⁰C).
- At (30⁰C), the PWM circuit stabilizes the heat produced by bulbs by changing the performance of duty cycle at 90% and 50%.
3) Results on the Pulse Width Modulation (PWM)

Figure 3 : Results on the Pulse Width Modulation (PWM)
- 90% performance of duty cycle : Refer to Figure 3, the temperature will increase until it reaches at the set point temperature, 37⁰C. This increment is happened in 112 seconds. At this stage, the PWM circuit will turn to 50% of duty cycle’s performance.
- 50% performance of duty cycle : At this stage, the PWM circuit controls the heat produce either in 50% or 0% (cut-off) to maintain the temperature at 38⁰C in the compartments.
Conclusion :
1) The LM35 is chose to be a heat sensor because of it generates a higher output voltage and proportional to the Celsius (oC) temperature.
2) Regarding on the graph in Figure 1, it shows that there is no overshoot temperature when using 2 bulbs.
3) Regarding on the graph in Figure 2 , it shows that there is an overshoot temperature when using 3 bulbs. The overshoot was in (2⁰C) over the set temperature. When the temperature was (2⁰C) more than set temperature, the PWM circuit will cut off and no heat was produced by bulb. The temperature decreased to set temperature.
4) The PWM method is used because of it is able to control the heat produced by the heat elements in percentage, 100%, 90% or 50%.
Thursday 29 March 2012
Week 10 : Design the hardware
Week No : 10 Date : 29/3/2012
Title of Activity : Design the hardware
Objective :
1) To find & select a suitable components.
2) To design the project hardware.
3) To complete the project objective.
Content / Procedure :
1) Make research about the component that suitable for the project.
2) Research about how to design the project.
3) Build the ' smart phototherapy ' hardware by using the component listed.
4) Tested the hardware.
Result and Analysis :
1) Design assumption hardware that compatible to this project.
2) There are consisted of 2 compartments :
- The heat element is located at the below compartment.
- The above compartment is the area to measure the temperature which is the temperature sensor is located at this part.
3) Specification component in hardware :
a) LM35 heat sensor
b) Cooler fan 12V for air circulation.
c) Bulb 100W as heat element.
a) LM35 DZ heat sensor
- A precision integrated-circuit temperature sensor,where the output voltage is linearly proportional to the (oC) temperature.
b) Cooler fan 12V.
- Cooler fan has been used to absorb the heat produced at below compartment.
- At the center of compartment, there is one divider where located 12V cooler fan and air circulation hole.
c) Bulb 100W as heat element.
- Normal cap cool day light bulb and has standard wattage 100W.
- This bulb produce heat till (80 oC) in a few seconds.
- Produces a soft and gentle ambient light. Plus, has an ability to produce and diffuse more heat through its light.
Conclusion :
1) This project involved 2 major section : hardware & software.
2) In the hardware part, a prototype of ' smart phototherapy ' is built with a temperature sensor, controller board and pulse width modulation (PWM) circuit.
PICTURE & DIAGRAM

Thursday 22 March 2012
Week 9 : PIC program and testing of the project.
Week No : 9 Date : 22/3/2012
Title of Activity : PIC program and testing of the project.
Objective :
1) To design the flow of the process for the project.
2) To learn how to burn the program.
3) To combine between hardware part & software part.
Content / Procedure :
1) Design the process of the project objective.
2) Write the program in MPLAB IDE software.
3) Burn the IC and test the program.
4) The program must suitable with hardware compartment function.
Result and Analysis :
1) The program conversions from analog to digital.
2) Set the value should be same with the actual temperature in ' smart phototherapy ' incubator.
3) The program should include PWM concept when the system is running to control the heat produced by heat element.
4) Produces heat either 100% , 90% or 50%.
5) The program shows the LCD initializes before the result will be displayed on the LCD.
Conclusion :
The MPLAB IDE is used because of it is the highly optimized compilers for the PIC18 series micro-controllers, high performance PIC24 MCUS, dsPIC digital signal controller and PIC32 MX MCUS.
FLOW CHART & PICTURE

a) Figure shows the flow chart of PIC program process.

b) Figure shows the program been testing using PIC controller board & PWM circuit.
Friday 9 March 2012
Week 7 : PIC controlled board & PWM circuit board.
Week No : 7 Date : 8/3/2012
Title of Activity : PIC controlled board & PWM circuit board.
Objective :
1) To estimate the controlled board looks alike.
2) To control the heat by using PWM method.
Content / Procedure :
1) List down all the control component.
2) Draw the circuit in PCB lab and print out the circuit.
3) Hatching the circuit regarding on that had setting in the PCB lab layout.
4) Solder the component on the circuit board.
5) Test the circuit.
Result and Analysis :
1) The controlled board consist of :
- programmable integrated circuit (PIC)
- a power rectifier AC to DC
- LCD (16x2)
- push button
All these elements will be attached to the board.
2) Power rectifier function to convert alternate current (AC) to direct current (DC) by using transformer step down (240V/9V) as main supply for control board.
3) Push button as selected menu & LCD to display temperature & receive the decoded signal from PIC.
4) PWM will receive decoded signal from PIC to control the heater,where it more like switch for heater.
5) The main component in this circuit is MOC3041M, where this device consists of infrared emitting diode optically coupled to monolithic silicon detector performing the function of zero voltage crossing bilateral triac drives. It's designed for use with a triac in the interface of logic system to equipment powered from 240V AC lines such as solid relay.
Conclusion :
1) The controlled board need to design more specific & functional, so that to make it run smoothly.
2) PWM circuit need to functional because it's control the temperature that created by the bulbs.
PROCESS OF CONTROLLER BOARD CIRCUIT of PWM & PIC.

a) Step 1 : Figure shows the PWM circuit in PCB board layout.

b) Step 2 : Figure shows the PWM controller board circuit in hatching process by using acid.

c) Step 3 : Figure shows the PWM controller board circuit after hatching.

d) Step 4 : Figure shows the components in soldering progress on the PIC controller board circuit.
FINAL PICTURE
 Figure shows the combination of PIC controller board & pulse width modulation (PWM) circuit board altogether.
Title of Activity : PIC controlled board & PWM circuit board.
Objective :
1) To estimate the controlled board looks alike.
2) To control the heat by using PWM method.
Content / Procedure :
1) List down all the control component.
2) Draw the circuit in PCB lab and print out the circuit.
3) Hatching the circuit regarding on that had setting in the PCB lab layout.
4) Solder the component on the circuit board.
5) Test the circuit.
Result and Analysis :
1) The controlled board consist of :
- programmable integrated circuit (PIC)
- a power rectifier AC to DC
- LCD (16x2)
- push button
All these elements will be attached to the board.
2) Power rectifier function to convert alternate current (AC) to direct current (DC) by using transformer step down (240V/9V) as main supply for control board.
3) Push button as selected menu & LCD to display temperature & receive the decoded signal from PIC.
4) PWM will receive decoded signal from PIC to control the heater,where it more like switch for heater.
5) The main component in this circuit is MOC3041M, where this device consists of infrared emitting diode optically coupled to monolithic silicon detector performing the function of zero voltage crossing bilateral triac drives. It's designed for use with a triac in the interface of logic system to equipment powered from 240V AC lines such as solid relay.
Conclusion :
1) The controlled board need to design more specific & functional, so that to make it run smoothly.
2) PWM circuit need to functional because it's control the temperature that created by the bulbs.
PROCESS OF CONTROLLER BOARD CIRCUIT of PWM & PIC.

a) Step 1 : Figure shows the PWM circuit in PCB board layout.

b) Step 2 : Figure shows the PWM controller board circuit in hatching process by using acid.

c) Step 3 : Figure shows the PWM controller board circuit after hatching.

d) Step 4 : Figure shows the components in soldering progress on the PIC controller board circuit.
FINAL PICTURE

Wednesday 29 February 2012
Week 6 : Air circulation and make power supply 240V , transformer 9V/0.2A.
Week No : 6 Date : 1/3/2012


Title of Activity : Air circulation and make power supply 240V , transformer 9V/0.2A.
Objective :
1) To make the air circulation is at the maximum.
2) To design the power supply for 240V.
3) To convert the power supply from 240V to 9V dc.
Content / Procedure :
1) Searching the information from the internet.
2) Getting the information about the air circulation.
3) Know the air circulation function.
4) Design the power supply using socket outlet 13A.
5) Convert the voltage using transformer 9V/0.2A.
Result and Analysis :
1) The air circulation can be occurred as a result of a heat air movement in a different air pressure are going to up and move down.
2) The air movement occurs because the atmosphere heating is not distributed evenly.
3) The air moves from the relatives chilled & high pressured area to the relative warm & low pressured area.
a) Socket outlet 13A.
- Shall be of 3 rectangular pin, has life,neutral and earth prongs.
- The plug has a fuse inside that required to protect the cord of wires.
b) Transformer 9V/0.2A.
- Step down the voltage 240V to 9V/0.2A.
- A power supply is a device that supplies electrical energy to one or more electric loads.
- The terms is commonly applied to devices that converted to one form of electrical energy to another, through it may also refer to devices that convert another energy form to electrical energy.
Conclusions :
1) To circulate the air effectively, absorb fan should be used. The type of absorb fan is depending on the quantity of circulated air and the speed to circulate air.
2) Every power supply must be obtained the energy it supplies to its load as well as any energy it consumes while performing that task from an energy sources.
PICTURES & DIAGRAM.
a) Figure shows the socket outlet 13 Ampere.
b) Figure shows the transformer 9V/0.2A.

c) Figure shows the power supply for socket outlet 13A, transformer 9V/0.2A and adapter.
Tuesday 21 February 2012
Week 5 : Temperature Sensor ( LM 35 )
Week No : 5 Date : 23/2/2012
Title of Activity : Temperature Sensor ( LM 35 )
Objective :
1) To make sure low and high temperature detected.
2) To know how the sensor function.
Content / Procedure :
1) Research on website about sensor LM35.
2) Search on how to connect the LM35 with the project circuit.
Result / Analysis :
1) LM35 DZ is a precision IC temperature sensor.
2) The output voltage is linearly proportional to the ( oC ) temperature.
3) The LM35 DZ has an advantage over linear temperature sensor calibrated in ( Kelvin ), as the user is not required to subtract a large constant voltage from its output to obtain convenient centigrade sealing.
Conclusion :
1) This type of sensor can calibrated directly in ( oC ) and the linear is ( +10.0 mV/ oC ) scale factor.
2) The rated for full scale is ( -55 oC ) to ( +150 oC ) range.
3) This sensor can operates from ( 4V to 30 V ).
4) It has low self heating ( 0.08 oC ) in still air.
PICTURE DIAGRAM OF LM 35DZ

a) Example of heat sensor LM35 DZ

b) Schematic diagram of heat sensor LM35 DZ
Title of Activity : Temperature Sensor ( LM 35 )
Objective :
1) To make sure low and high temperature detected.
2) To know how the sensor function.
Content / Procedure :
1) Research on website about sensor LM35.
2) Search on how to connect the LM35 with the project circuit.
Result / Analysis :
1) LM35 DZ is a precision IC temperature sensor.
2) The output voltage is linearly proportional to the ( oC ) temperature.
3) The LM35 DZ has an advantage over linear temperature sensor calibrated in ( Kelvin ), as the user is not required to subtract a large constant voltage from its output to obtain convenient centigrade sealing.
Conclusion :
1) This type of sensor can calibrated directly in ( oC ) and the linear is ( +10.0 mV/ oC ) scale factor.
2) The rated for full scale is ( -55 oC ) to ( +150 oC ) range.
3) This sensor can operates from ( 4V to 30 V ).
4) It has low self heating ( 0.08 oC ) in still air.
PICTURE DIAGRAM OF LM 35DZ
a) Example of heat sensor LM35 DZ

b) Schematic diagram of heat sensor LM35 DZ
Tuesday 14 February 2012
Week 4 : Pulse Width Modulator ( PWM ) circuit and Triac BT 139.
Week No : 4 Date : 16/2/2012
Title of Activity : Pulse Width Modulator ( PWM ) circuit and Triac BT 139.
Objective :
1) To understand how the PWM works.
2) To research and design the function of Triac BT 139.
Content / Procedure :
1) Make research on website about the PWM circuit & how to use it.
2) Design how to connect the PWM circuit with the micro-controller.
3) The function of Triac BT139 for using in the circuit.
Result and Analysis :
1) Pulse Width Modulator (PWM) circuit will receive decoded signal from PIC to control the heat, whereas the PWM is more like switch for heater.
2) The main component in this circuit is MOC3041M, whereas this device consist of infrared emitting diode optically coupled to a monolithic silicon detector performing the function of a zero voltage crossing bilateral triac drives.
3) BT139 are using in this circuit, whereas its glass passivited triacs in a plastic envelope,intended for use in application requiring high bidirectional.
4) Blocking voltage capability and high thermal cycle performance.
5) Typical used include motor control,industrial and domestic lighting, heating and static switching.
6) The maximum voltage triac can be supported is 500V and maximum current can support is 16A.
Conclusion :
By using PWM circuit, the heat control for the project will be efficiency & the process of project will run well.
PICTURE & DIAGRAM OF TRIAC BT139 & MOC3041M

a) Pin configuration of Triac BT139

b) Symbol Triac BT139

c) Schematic diagram for MOC3041M

d) Figure shows about the zero voltage crossing
Title of Activity : Pulse Width Modulator ( PWM ) circuit and Triac BT 139.
Objective :
1) To understand how the PWM works.
2) To research and design the function of Triac BT 139.
Content / Procedure :
1) Make research on website about the PWM circuit & how to use it.
2) Design how to connect the PWM circuit with the micro-controller.
3) The function of Triac BT139 for using in the circuit.
Result and Analysis :
1) Pulse Width Modulator (PWM) circuit will receive decoded signal from PIC to control the heat, whereas the PWM is more like switch for heater.
2) The main component in this circuit is MOC3041M, whereas this device consist of infrared emitting diode optically coupled to a monolithic silicon detector performing the function of a zero voltage crossing bilateral triac drives.
3) BT139 are using in this circuit, whereas its glass passivited triacs in a plastic envelope,intended for use in application requiring high bidirectional.
4) Blocking voltage capability and high thermal cycle performance.
5) Typical used include motor control,industrial and domestic lighting, heating and static switching.
6) The maximum voltage triac can be supported is 500V and maximum current can support is 16A.
Conclusion :
By using PWM circuit, the heat control for the project will be efficiency & the process of project will run well.
PICTURE & DIAGRAM OF TRIAC BT139 & MOC3041M

a) Pin configuration of Triac BT139
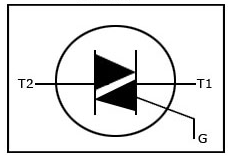
b) Symbol Triac BT139

c) Schematic diagram for MOC3041M

d) Figure shows about the zero voltage crossing
Saturday 11 February 2012
Week 3 : Micro-C circuit
Week No : 3 Date : 9/2/2012
Title of Activity : Micro-C circuit
Objective :
1) To identify what kind of circuit or micro-controller that will be used.
2) To ensure the circuit that can be used.
Content / Procedure :
1) Researching about the micro-controller that have been selected to support the project.
Result / Procedure :
1) After make a research , the type of IC that would be used is PIC 16F877A.
2) This IC have many port & ADC port compare than PIC 16F84A that have less port.
3) This IC is needed a power supply where the F305 regulated power supply used to supply 5V.
Conclusion :
1) Based on the research from the internet, the PIC 16F877A is selected. This IC is compatible because it have an ADC port that can support the input signal and have many port to use from port A,B,C & D. This IC also needed a voltage regulated circuit to use as power supply to the PIC.
Week 2 : Block Diagram & Flow Chart
Week No : 2 Date : 2/2/2012
Title of Activity : Block Diagram & Flow Chart
Objective :
1) To make this project is easy to understand and look reliable.
2) To test write the program in the proper way.
Content / Procedure :
1) Making the block diagram from input processor & output.
2) To make a flow in the proper way to write the program.
3) Understand how the project is running.
Result and Analysis :
1) By using a block diagram to understand this project more easier.
2) The flowchart is made to start the program writing.
3) Understanding how the project operate by referring to the flowchart & block diagram.
Conclusion :
1) By using block diagram & flowchart, it can give more understanding about the flow of the program to finish up this project well.
2) Thus, the flowchart is really important in this project. So that, the progress will be going smoothly without any disturbances.
BLOCK DIAGRAM
Saturday 4 February 2012
Week 1: Progress activities for the Degree Semester 2 Final Year Project
Week No : 1 Date : 26/1/2012
Title of Activity : Progress activities for the Degree Semester 2 Final Year Project
Objective :
1) To get guidance and some advice from the advisor to proceed for the next level of project's progress.
2) To get the information and new-updated news about the FYP S1/2012.
Content / Procedure:
1) Having a short briefing about the updated news of final year project for Degree Semester 2.
2) The advisor explained to create a blog and make all the updated progresses of project inside the blog.
3) Log book is replaced with the blog. All the marks will be given based on the contents of blog.
Result and Analysis :
1) So, after met with Madam Siti Afifah Binti Mohshim, she had given all the useful tips for the progress project.
2) She had also explained more about what should do/don't during the progress of project.
Conclusion :
The project can be proceed with the guidance from the advisor and the updated of progress will be noted on the blog.
Subscribe to:
Posts (Atom)